Introduction
This is a speculative design project that critiques contemporary data collection practices for Machine Learning while also imagining alternative approaches. Much of design engages with machine learning through the outputs of a machine learning model, focusing on integrating machine learning into some kind of user experience. This project broadens that frame, concerning itself with the entire system and designing at the scale of the machine learning pipeline itself. More than a practical proposal for a new data collection system, Unstable Label is a set of ideas, provocations, and critiques that are intended to challenge contemporary practices and creatively imagine new paths forward.
By Adit Dhanushkodi, conceptualized and prototyped as a part of his MFA thesis project in the Media Design Practices program at ArtCenter College of Design
How to use this Manual
Unstable Label is a participatory, civic data labeling application that proposes an alternative approach to building datasets for machine learning: rather than treating data labels as a fixed set of categories, what if categories were constantly re-labeled, re-contextualized, and re-imagined based on each contributors’ own experiences? By treating labeling as an active process of meaning making, Unstable Label asks what it would look like to use machine learning as a space to contest meaning, arguing for an approach that embraces situated data instead of striving for the impossibility of objective data.
This user manual will guide you through the use of Unstable Label, explaining how you could contribute to the model. Throughout the manual, there are convenient opportunities to try out the main capabilities of the app. This will let you experience the primary interactions within the sandbox of this webpage. Finally, this manual also serves as a long “about” page for the app, providing narrative text that explains the theory and concepts that drove the design of the system.
Once you feel comfortable with the intention and capabilities of the app, you’ll be ready to contribute to the live instance at https://unstable-label.glitch.me
Included Components & Topics

In this manual, you will find the following topics discussed:
- Contributing data from a situated perspective
- Countering the process of data alienation
- Relabeling as a category creation process
- Incorporating stories and narratives into data
- Rejecting the myth of objective data
- Machine learning as a process of world building
- Decentering the mathematical aspects of the model
- Visualizing the contingent and unstable nature of data
System Requirements Values
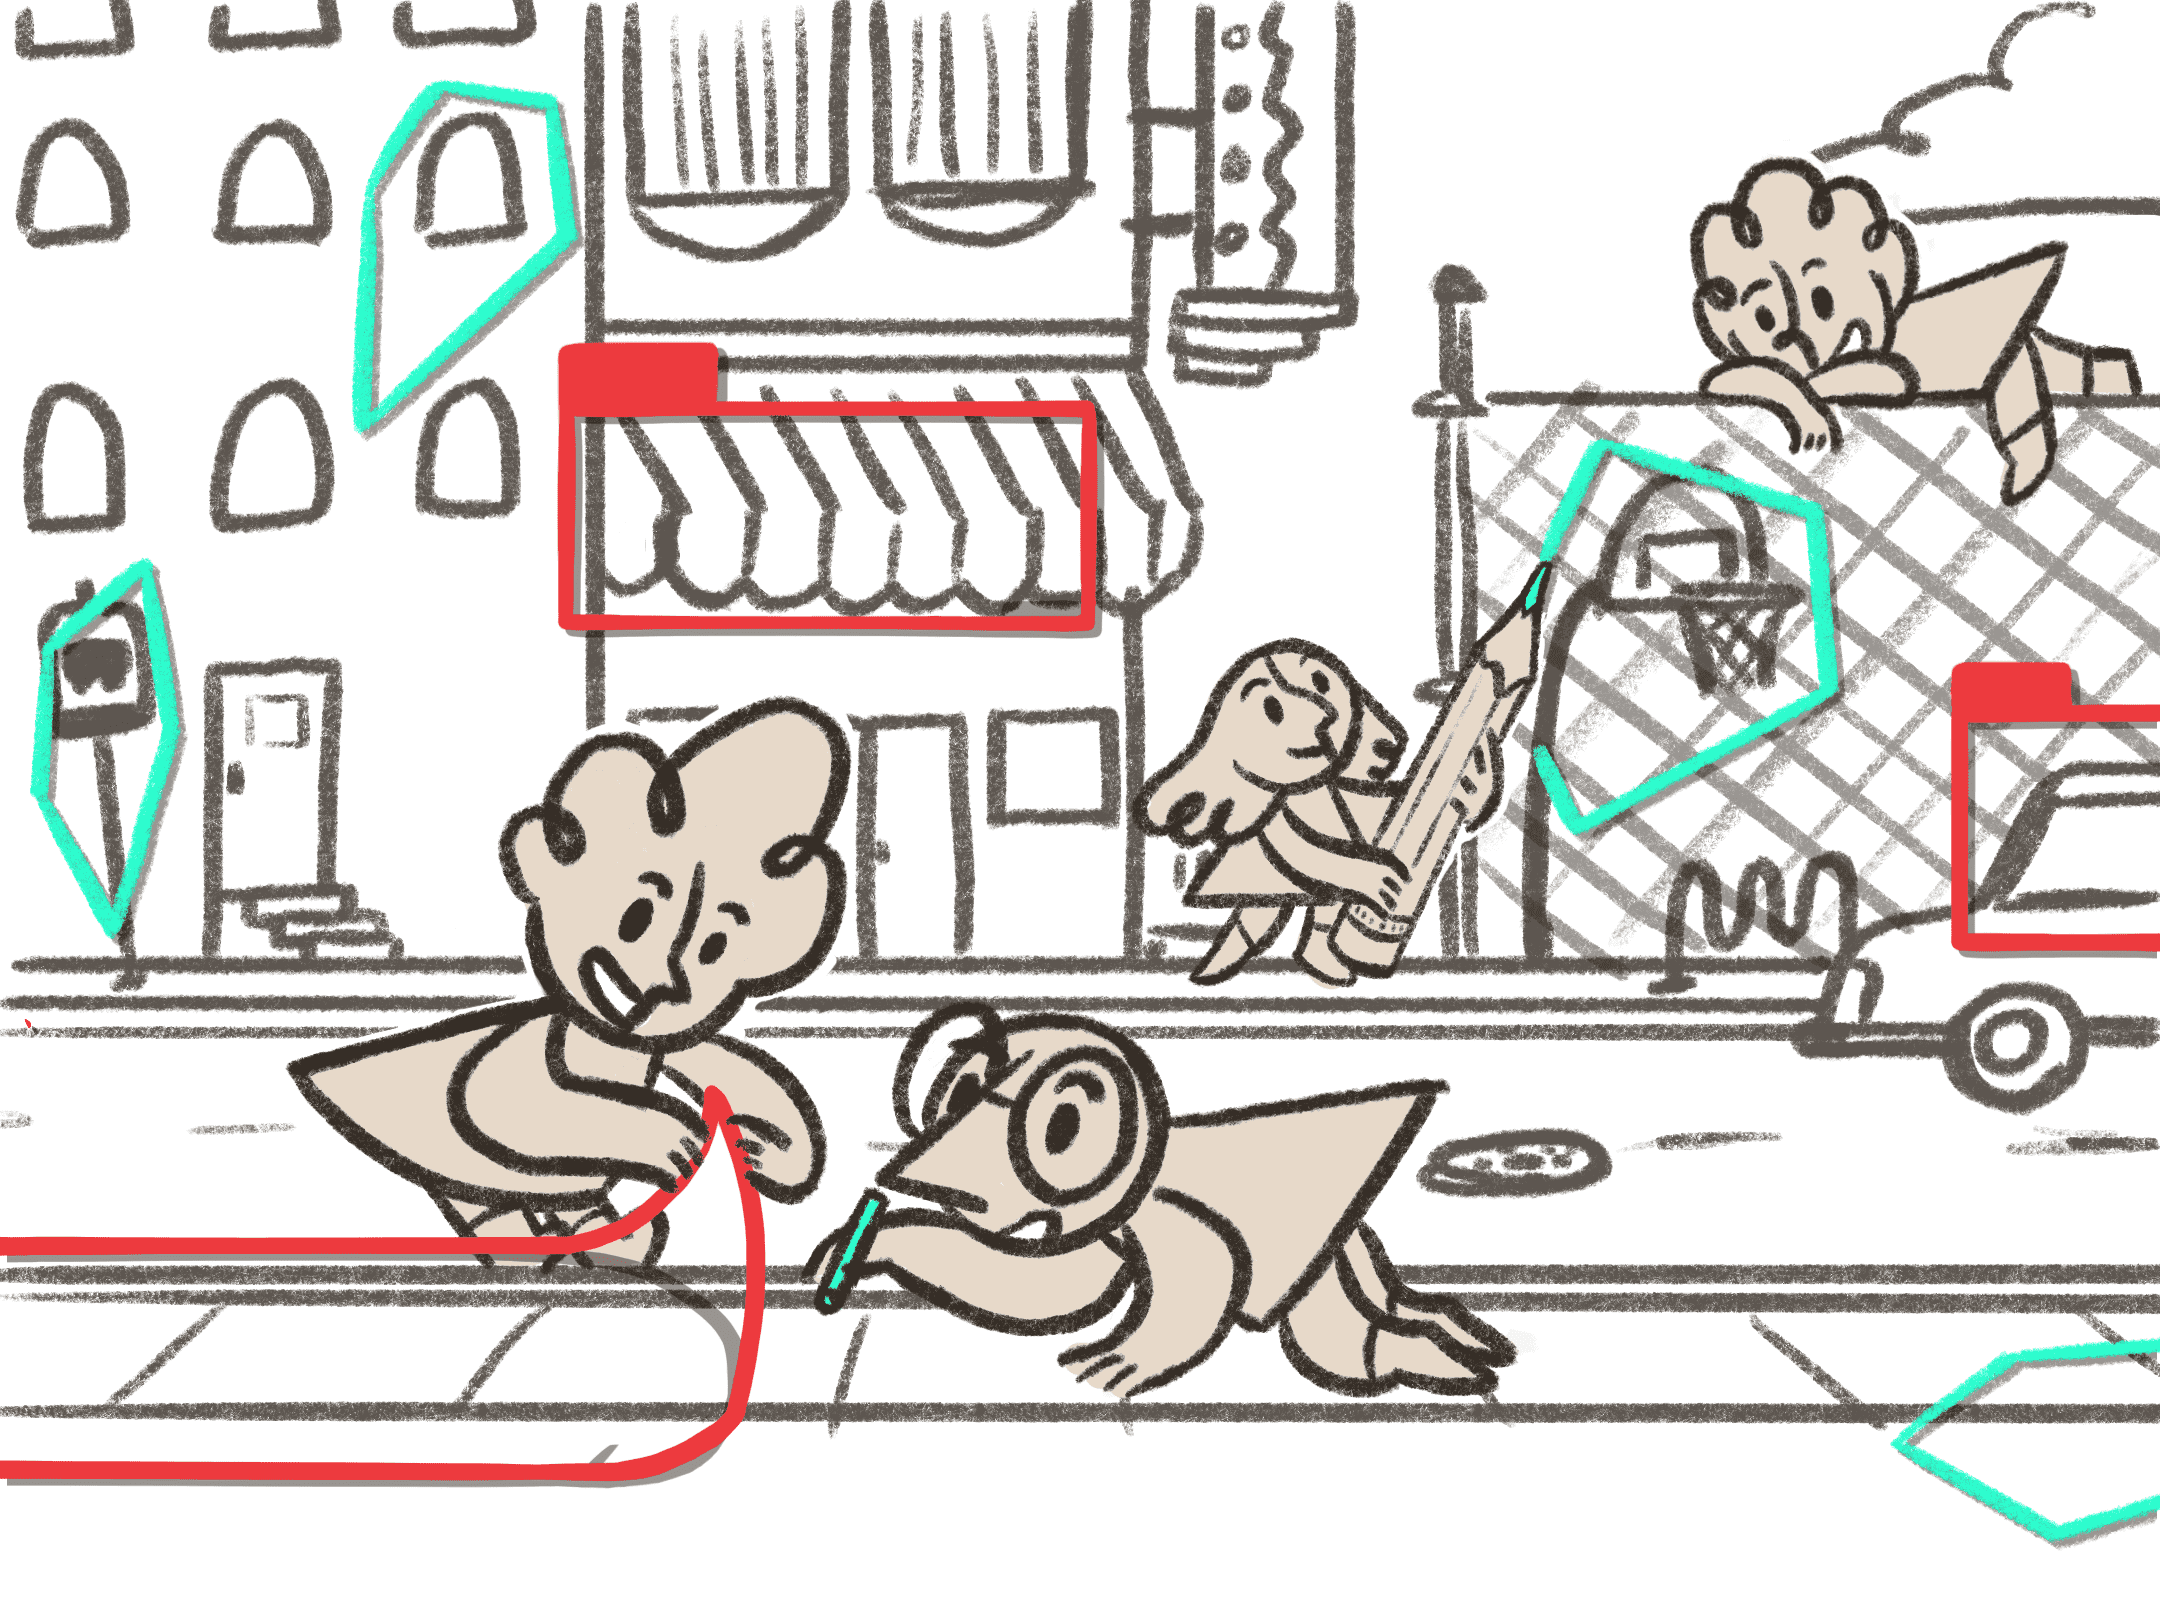
There are three values that the Unstable Label has been built from, which can be seen as prerequisites for anyone planning on contributing and using the system.
Situated Perspective
To contribute, you must bring your own situated perspective. This means you must speak from your own perspective -- from your local context and community. Typical machine learning data labeling processes prioritize universal, often at the expense of locally situated stories and perspectives. As you’ll see in various parts of this system, Unstable Label puts this value into effect primarily by:
- Asking users to label from places they have personal experiences in.
- Requiring users to create their own categories, rather than using ones that were predefined by the creators of the system.
Collective Experience
Unstable Label has been designed with the intention that you contribute to the model through a group conversation with your community. The app should serve as a prompt for group conversations about what the model is labeling, and how you might relabel it based on your own personal experiences in that location. Whenever you are contributing to the model, you are doing so in relation to the previous contributors as well as the people in your community that you are in conversation with.
Slowness
The final requirement is to contribute at a slow pace. This process is not about speed or efficiency. The process of creating a category and drawing data to contribute to the model is a slow one that includes conversations with the people around you and the previous people who have contributed to the model. The larger goal for this system is to create spaces and moments to contest meaning and negotiate understanding. This cannot happen at the default scale and “efficiency” that much of the extended Machine Learning industry operates at. It requires a slower, more deliberative pace.
As you will see through this manual, the overarching goal for this system is to create spaces to contest meaning and negotiate understanding. This does not happen at the default speeds and “efficiencies” that much of the Machine Learning industry operates at. It requires a slower, deliberative pace.
Selecting a Datasource
The first step in using the Unstable Label system is selecting a data source to analyze. Currently, there is only support for Google Street View, but support for custom, small scale data collection devices will be coming soon. Regardless of the datasource used, the goal is to emphasize the local context and situated nature of the collected data.
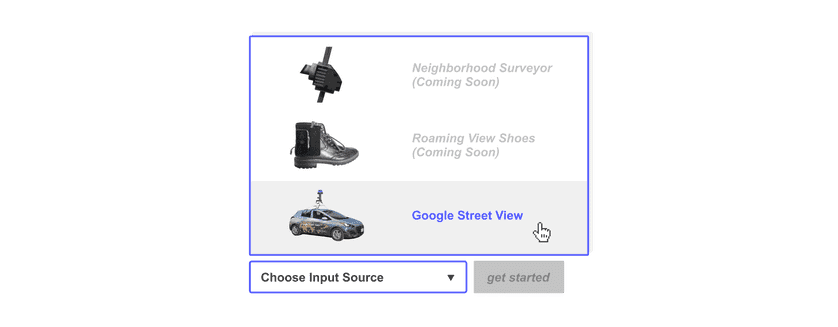
Google Streetview
Warning
For the purposes of prototyping, Google Street View is the only data source that can be used. As a form of data collection, Google Street View has significant ethical issues. Despite the legality of recording images from public property in many parts of the world, the mundane and universalist production of data reflects an attitude towards people and the built environment that sees them as pieces of information and pixels. These values are at odds with the goals of this application.
In it’s everyday use, the concept of “data” has largely been seen as a universal material that remains unchanged regardless of context. This view of data has been largely influenced by the construction of “information” during the Macy Conferences on Cybernetics. N. Katherine Hayles has documented how “information lost its body, that is, how it came to be conceptualized as an entity separate from the material forms which it is thought to be embedded.” Data is now seen in a similar matter: as an entity that is interchangeable and “can flow unchanged between material substrates.” This decontextualization makes it possible to bring together data from multiple sources and treat them as homogenous entities.
Data collection is fundamentally a process of standardization, of removing differentiating context to make data freely exchangeable. This is quite similar to a process of alienation seen in the context of commodification and supply chains, where “people and things become mobile assets; they can be removed from their life world in distance defying transport to be exchanged with assets from other life worlds, elsewhere.”
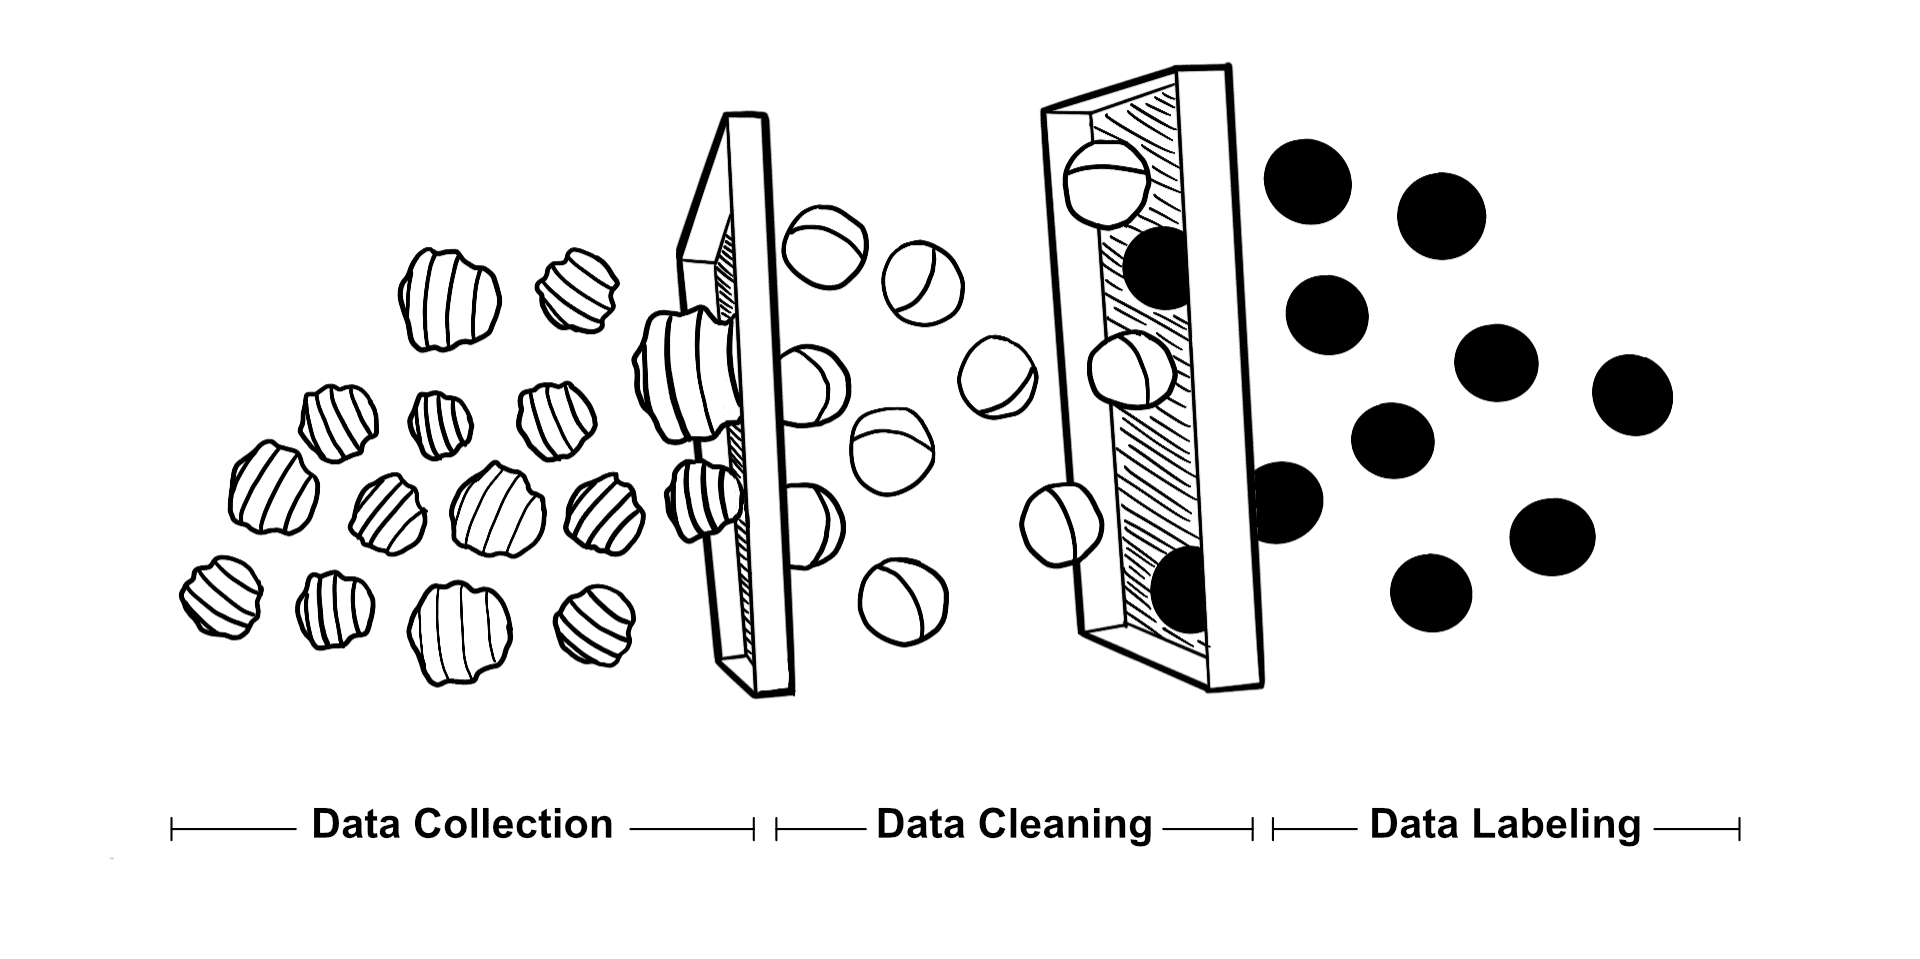
The process of data alienation achieves a similar effect, decontextualizing information, thoroughly sanding down that piece of data until it fits within the structure of a computational model, where it can be compared to data from other life worlds. It’s a process of abstraction that “flattens out individual variation in favor of types and models.”
Unstable Label chooses to take a situated perspective on data instead. Rather than being objective and universal across context, Unstable Label maintains that data and knowledge is situated in the embodied experiences of the knower. So, to contribute to the model, you first have to choose a location that you are familiar with, and you have had experience in.
Try it Yourself:
- Search for a place that you have first-hand experience with. It could be an area of your local neighborhood that you commonly walk through, or some place from your childhood that you have strong memories of.
- Move the pin icon to a specific location on the street that you would like to start from. You will be digitally “walking” through your chosen location by clicking and panning through the Google Street View interface.
By labeling data from a place that you have a personal relationship with, you are contributing more than simple labels to the system: you are bringing your specific perspective and lived experiences.
Roaming View Shoes
Neighborhood Surveyor
Using the Interface
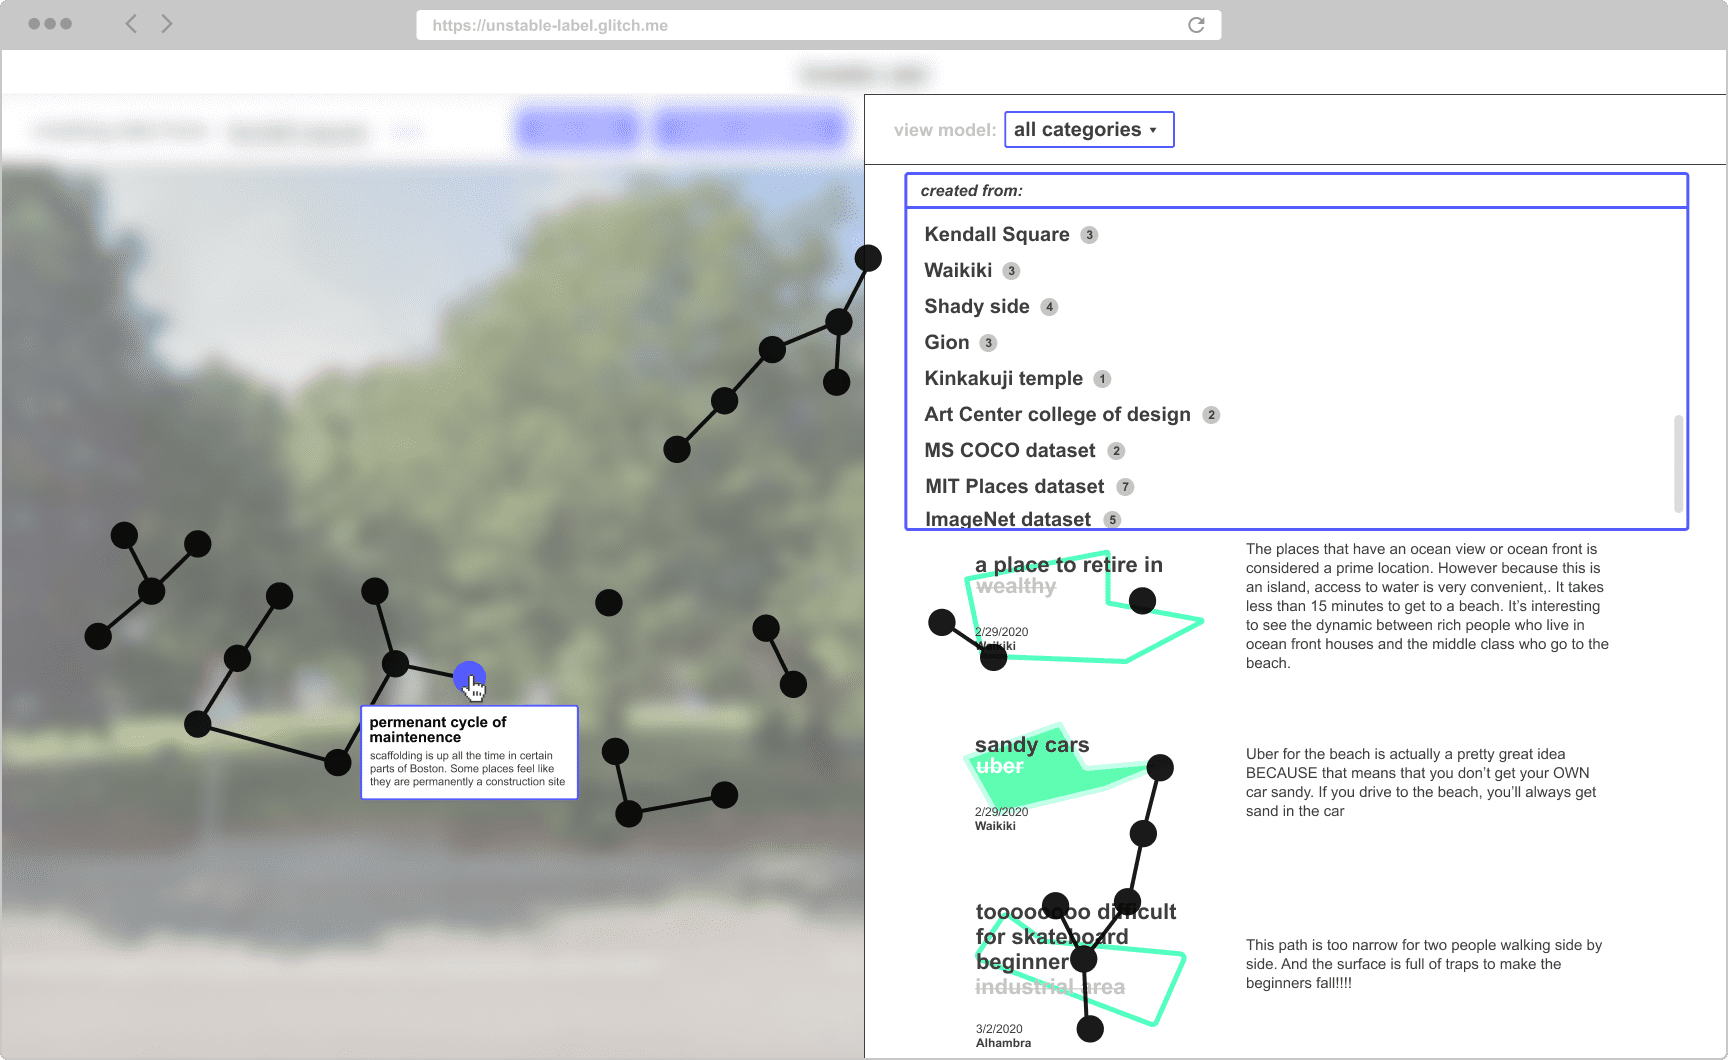
After choosing a location, you will be taken to the core of the interface:
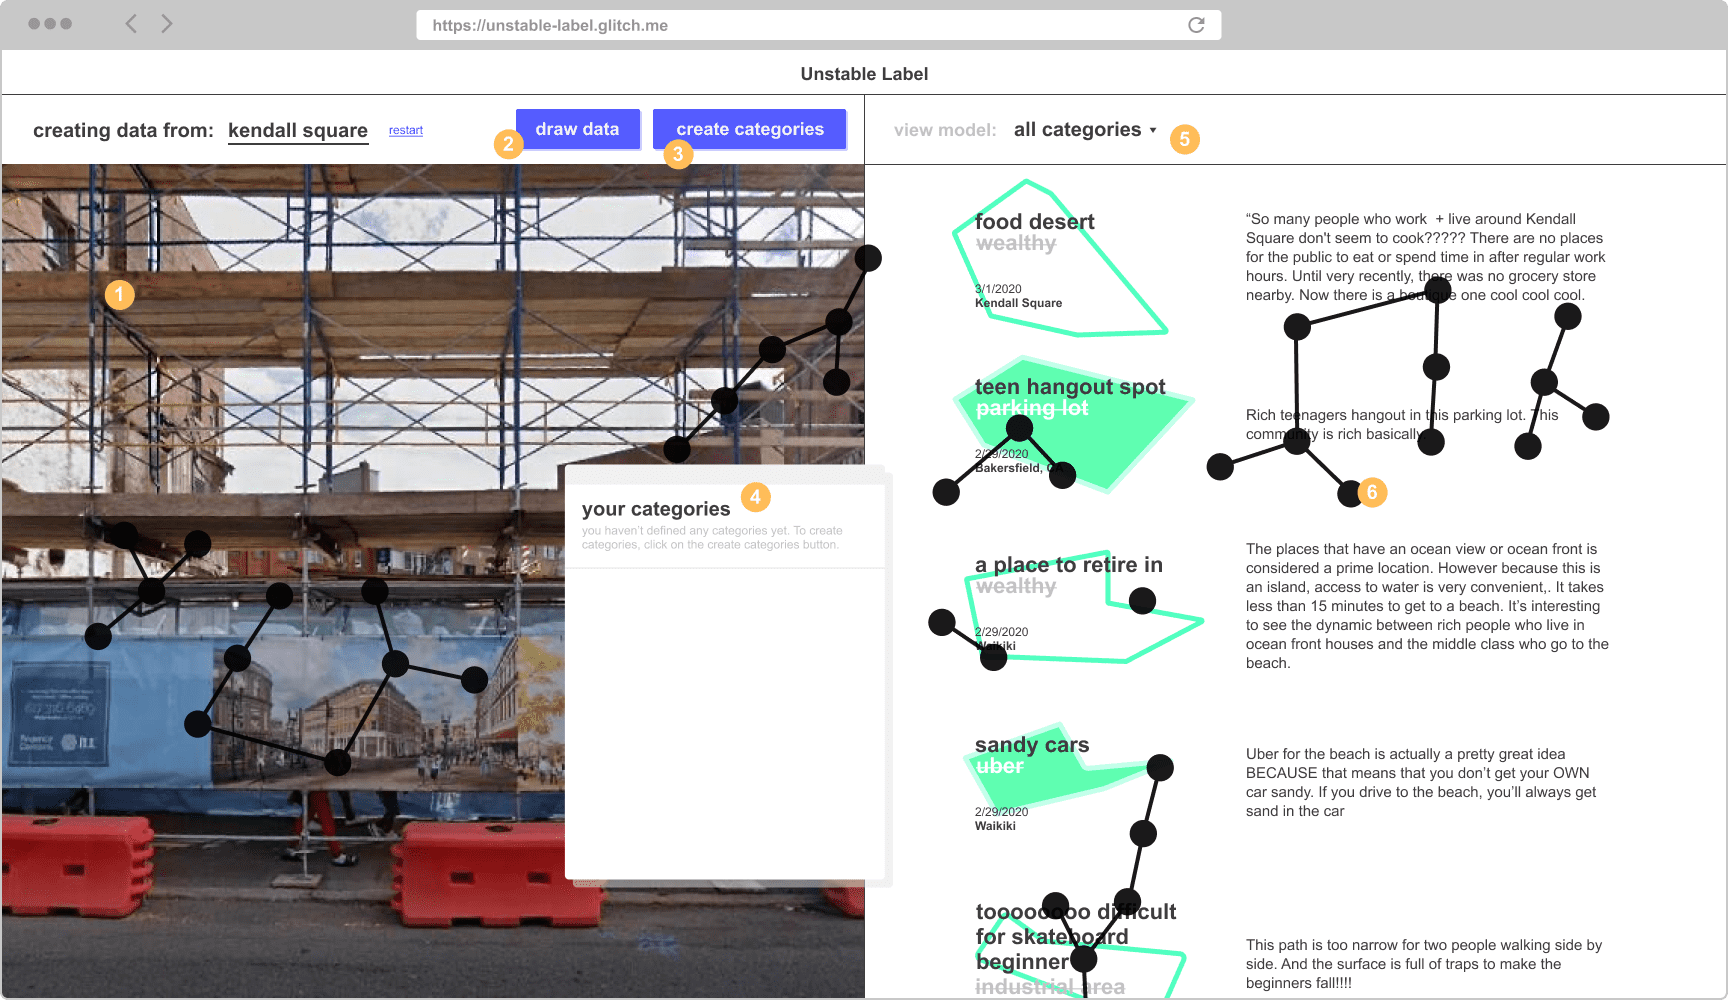
- Navigation Panel - Click, pan and drag to “walk” through the location you’ve chosen.
- Draw Data Button - Click here to open up the Draw Data Panel, which lets you annotate images with the categories you’ve created
- Create Categories Button - Click here to open up the Category Creation Panel, which you use to create new categories to use.
- Your Categories Dialog - Any categories you create will be listed here. You can drag categories from this dialog box onto the Draw Data Panel when annotating images.
- View Model Panel - The right side of the interface lists all the categories that have been contributed into the model. Use the dropdown at the top to see categories by session/location.
- Network Visualization - The network diagram that is layered over the whole interface visualizes the relationships between all the categories, tracing the history of each category that exists within the model.
Navigating your Data
To contribute to the model, start by navigating through your chosen location in the Navigation Panel, looking for scenes within the cityscape that remind you of personal experiences: of stories that could never be captured by a camera; of shared memories that live in the minds of you and your friends; of mundane daily rituals; of the small things you notice during everyday life; of the things that you feel define your neighborhood and community.
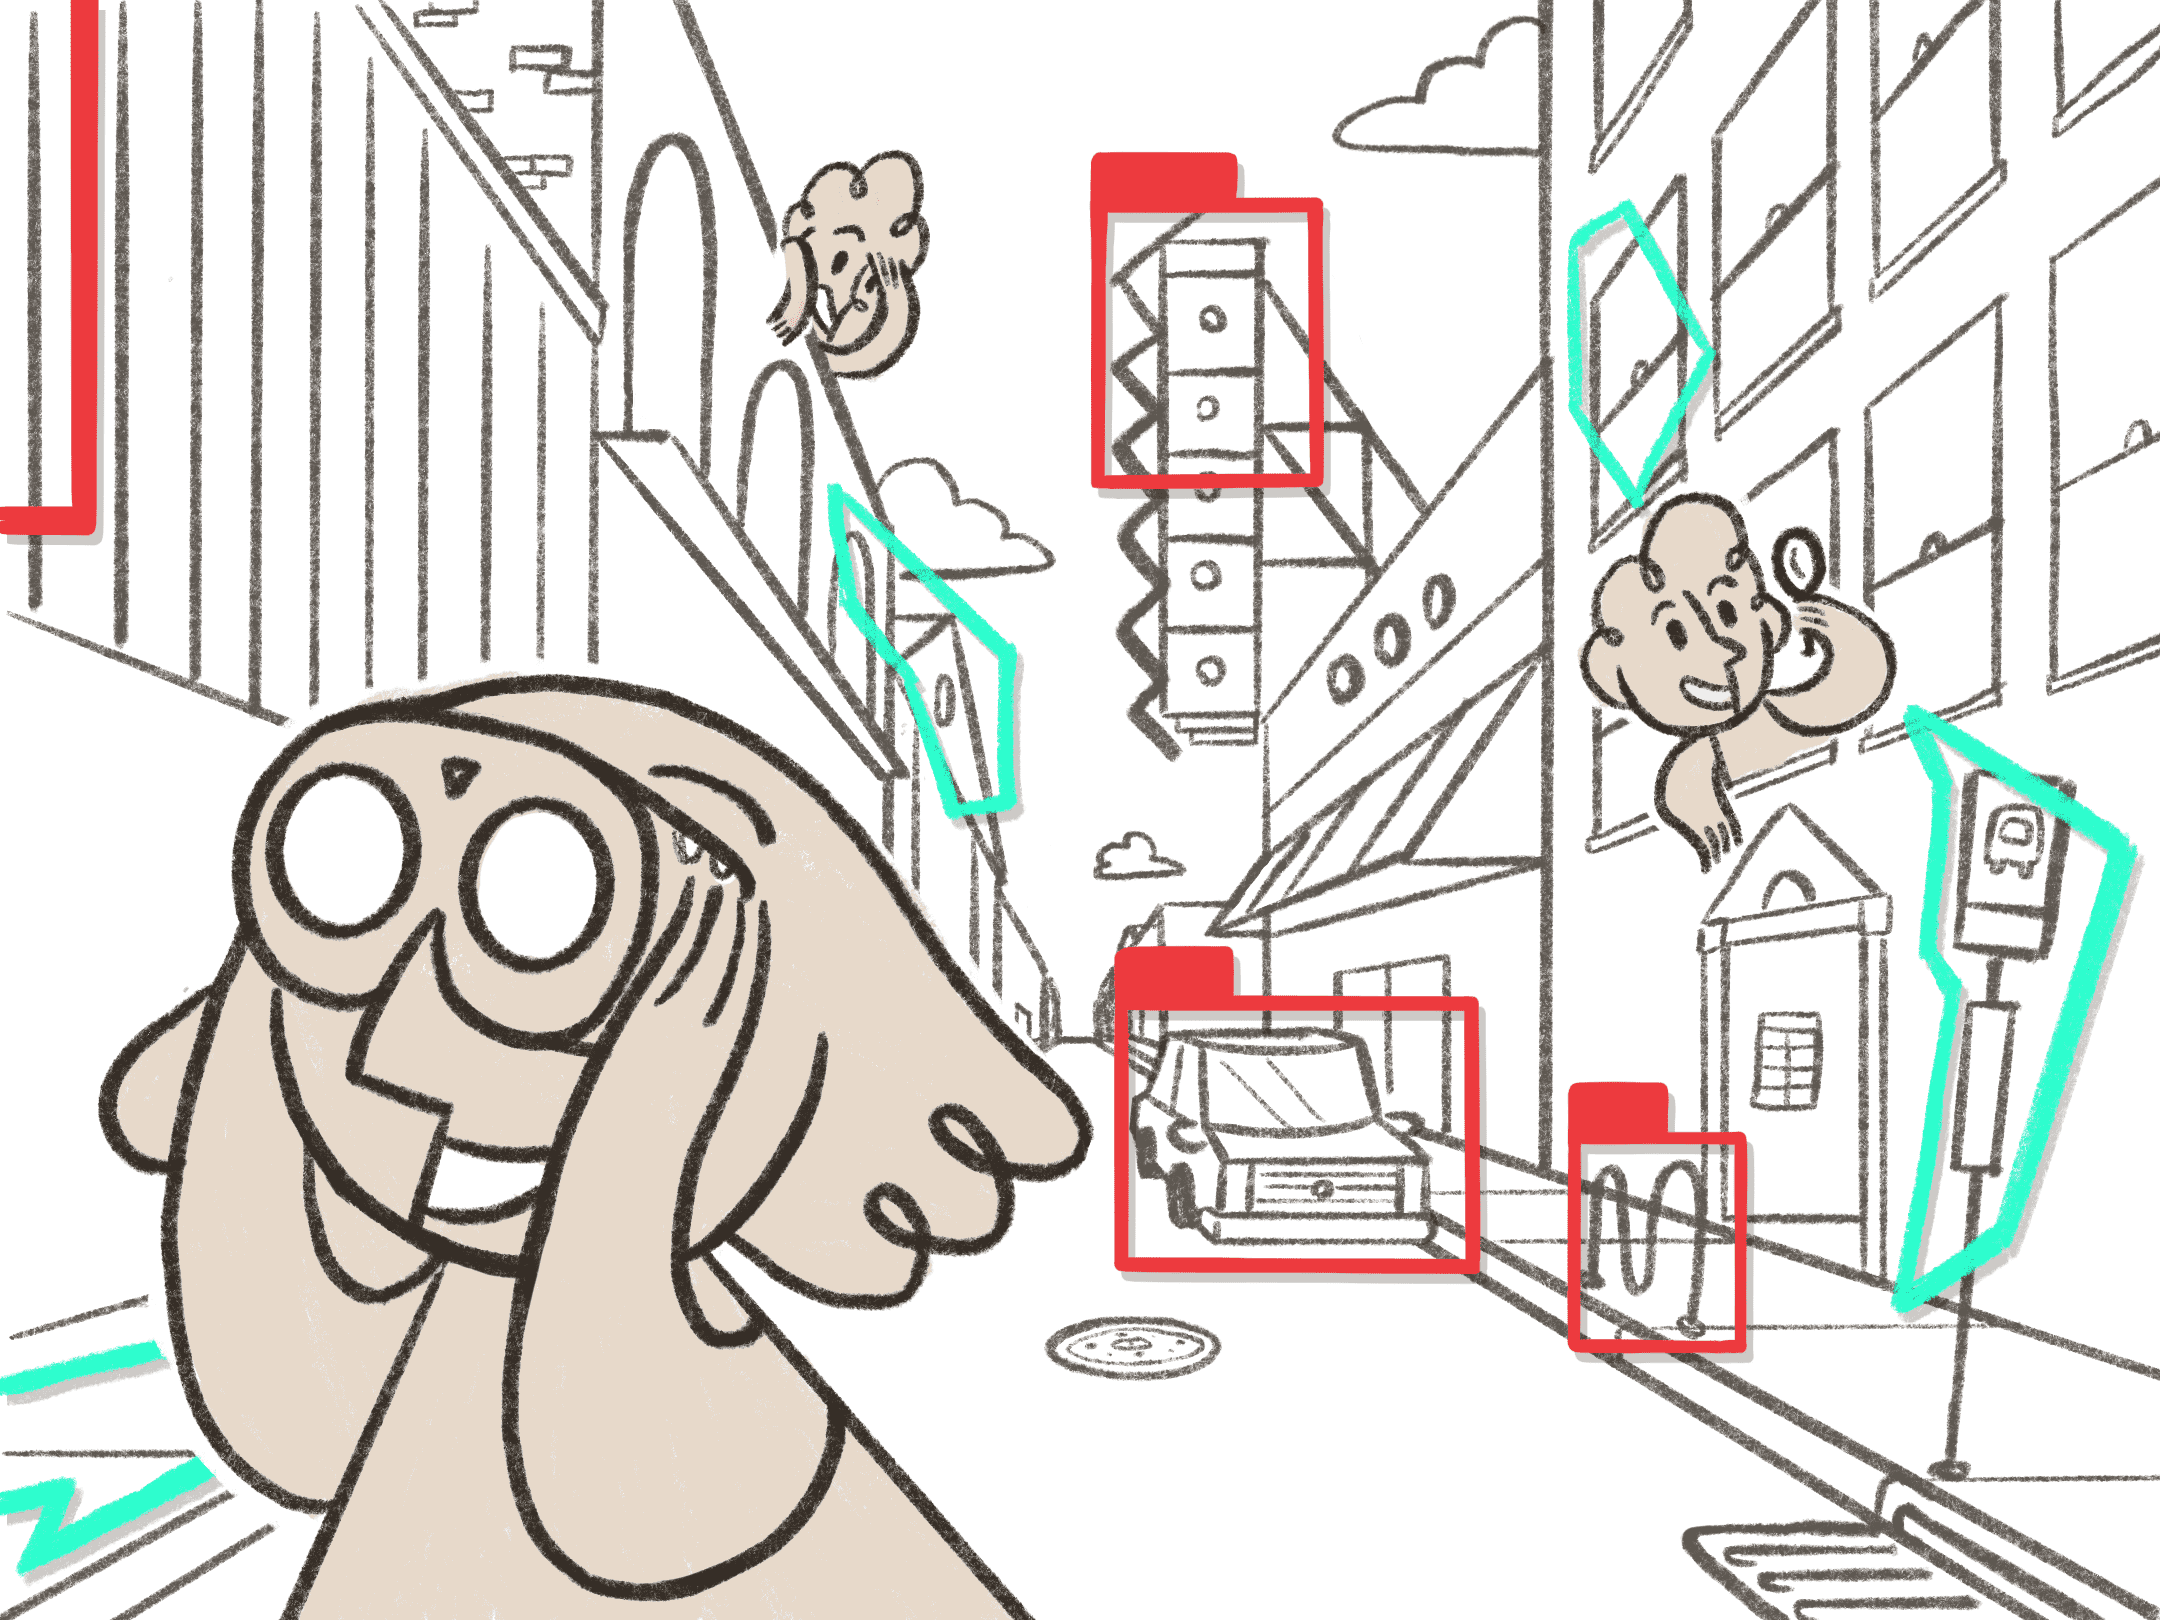
Unstable Label intentionally looks at the city from the perspective of the street to ground the system in a personal look at the city. Walking through a neighborhood can be a form of exploring, and noticing the built environment. Navigating through data in Unstable Label, whether it was from google street view or some other small scale data collection device, should feel similar -- like “walking” through the data. It slows you down, giving you the time to observe and reflect on the scene in front of you.
Try it Yourself:
- Click, pan, and drag to move through the data, starting from the location you searched for earlier.
- Search for a scene within the data that you find interesting. This scene will be used in the following sections to Create Categories and Draw Data.
- Once you settle on a certain location and camera angle, move on to the next section “Creating Categories.” Feel free to return here to change the scene you’ve picked at any time.
Note: There is no way to “teleport” to another street. You can only “walk” there by clicking and dragging your way to where you want to go. If you would like to restart in a new location, you can go back to the map and find a new place to start.
Creating Categories
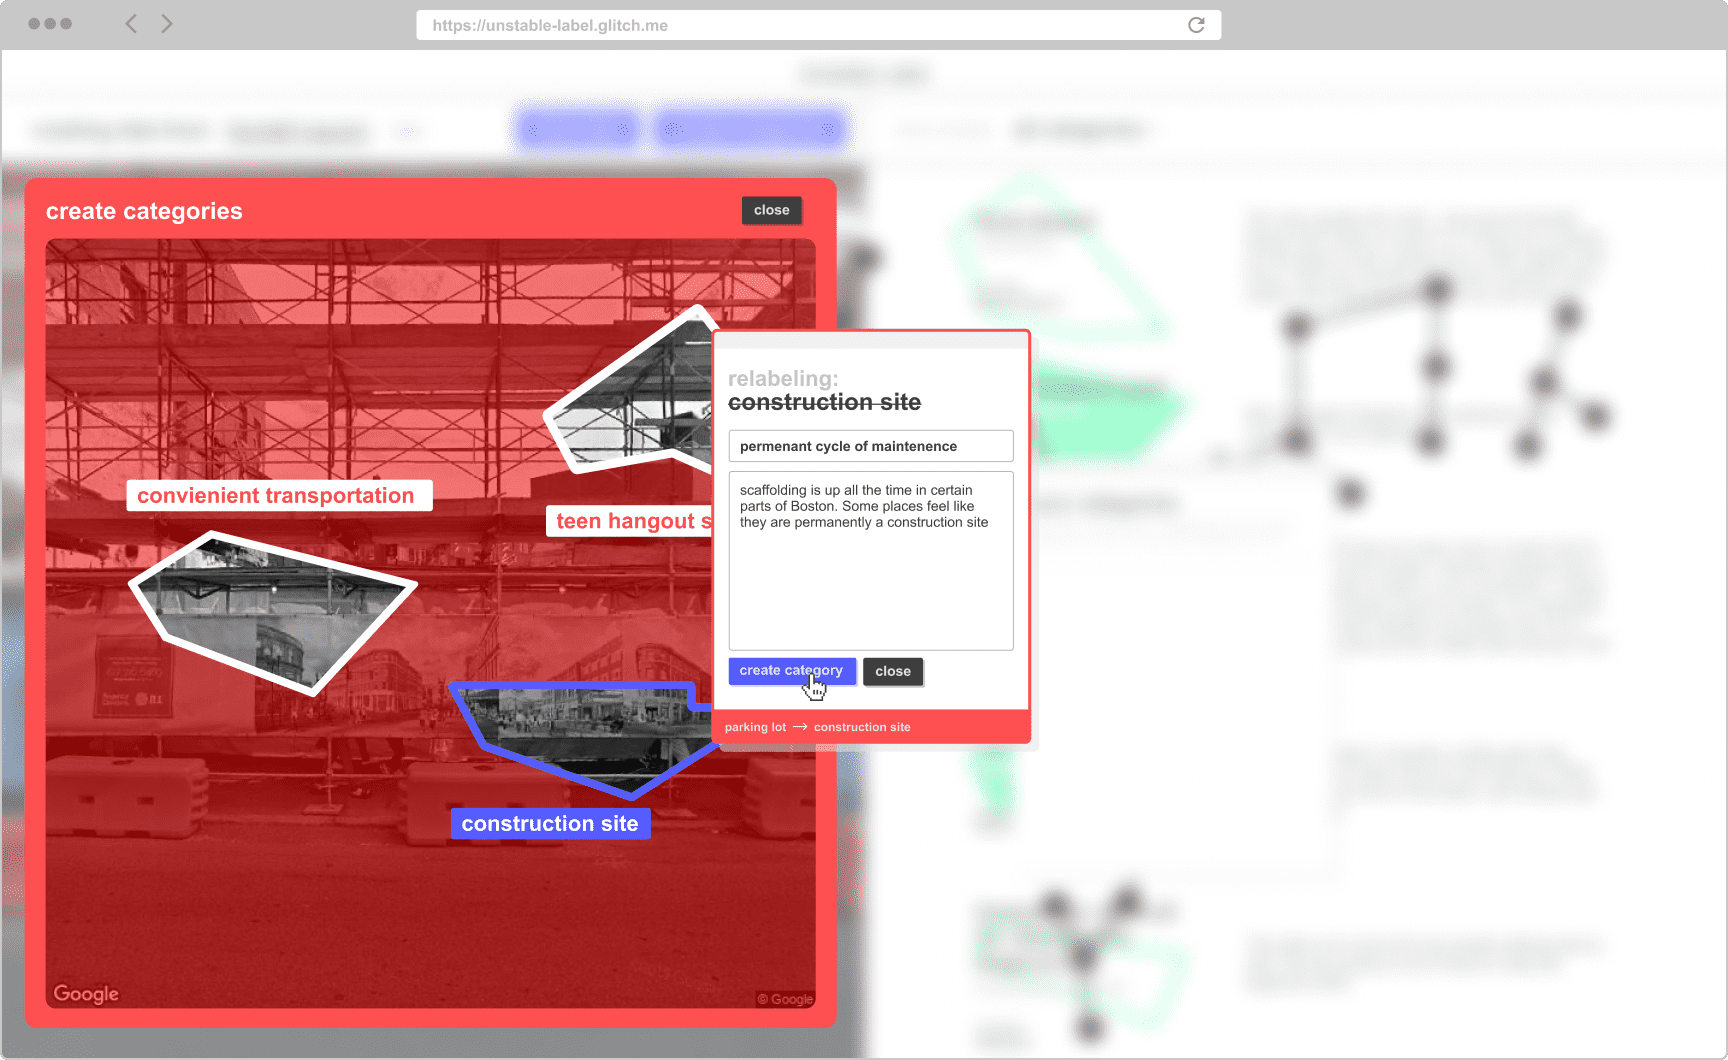
Labeling data to feed a machine learning algorithm starts with defining a set of categories to use to label that data. You can start creating categories in Unstable Label by clicking on the “create categories” button to open the corresponding overlay.

While the category definition process is usually a social one that isn’t considered central to the creation of a machine learning algorithm, the choice of categories frame the scope and worldview of the model that we will create.
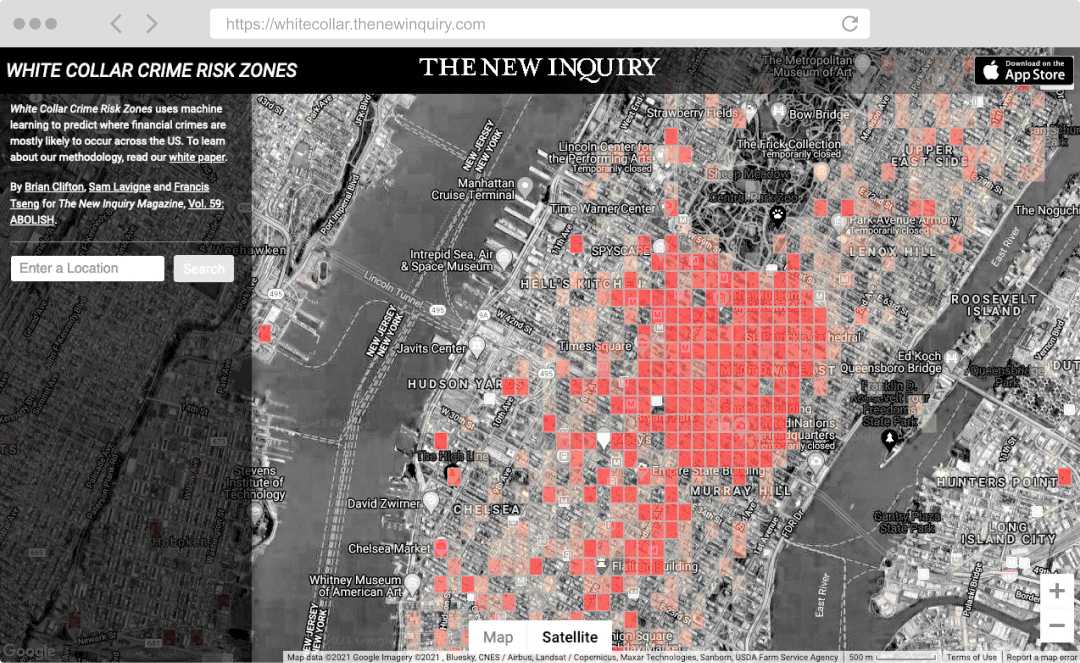
This is most plainly illustrated in the White Collar Crime Zones project, where the authors invert the gaze of data-driven policing algorithms from so-called “violent crimes” to “white collar crimes.” When an entirely different class of categories are used within the system, the resulting model predicts entirely new geographies in need of policing. Instead of highlighting areas like Los Angeles’ Skid Row, one of the most policed neighborhoods in the world, the model paints a significant portion of Manhattan red with potential crime. Focusing on category definition as a design site within machine learning systems allows us an opportunity to intervene in the resulting algorithm.
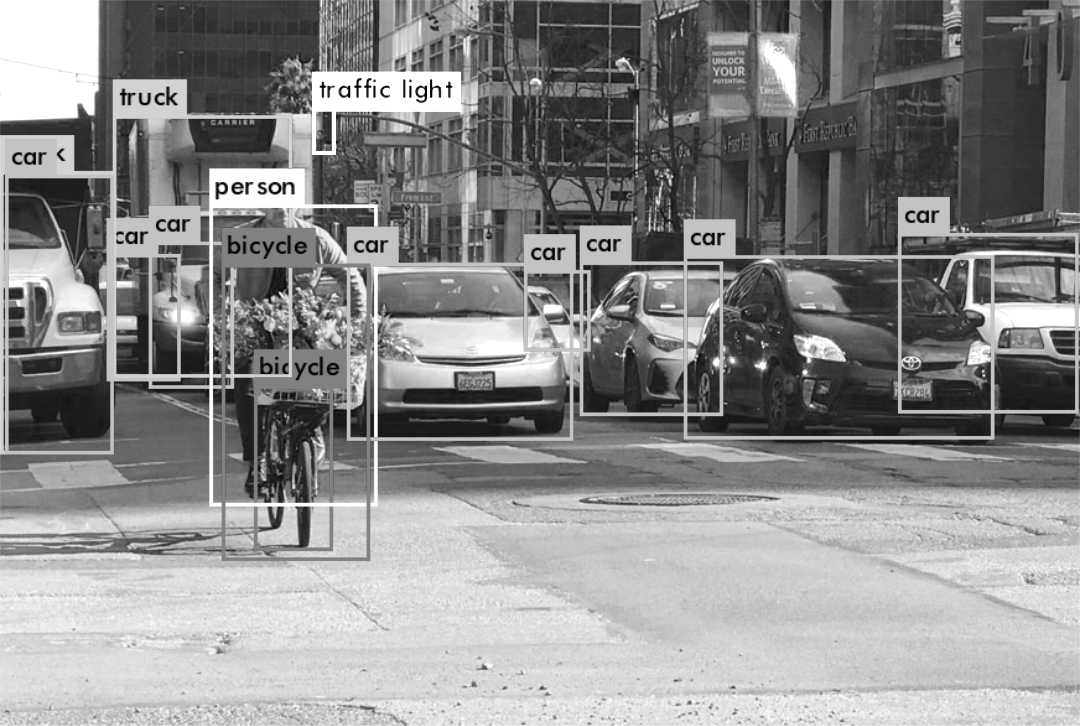
To understand Unstable Labels’ category definition tool, it’s useful to first understand standard industry practices for category definition. Most machine learning systems are built around a fixed set of possible categories which are used to label the data. In the large scale image detection dataset COCO there are 91 defined categories, while the larger ImageNet dataset is made up of 27 high level categories and 21,841 subcategories. Both of these models were fed data labeled by micro-gig economy workers on the Amazon Mechanical Turk (AMT) platform.
For each model, different approaches were employed by the academics running the projects to develop taxonomies to provide to the AMT workers. For the COCO dataset, the researchers combined a list of categories from an existing image classification dataset, a list of 1200 of the most commonly used words, and most unusually, a list of objects that children from ages of 4-8 could identify within images. The authors then voted on “usefulness for practical application,” which determined the final 91 categories. The assumption the authors implicitly make is that if a child under the age of eight can identify a category, then it must be a universal concept, regardless of where that child is from, their class, upbringing or education. It’s clear from this process how category definition codes values of utility and universalism into the final dataset.
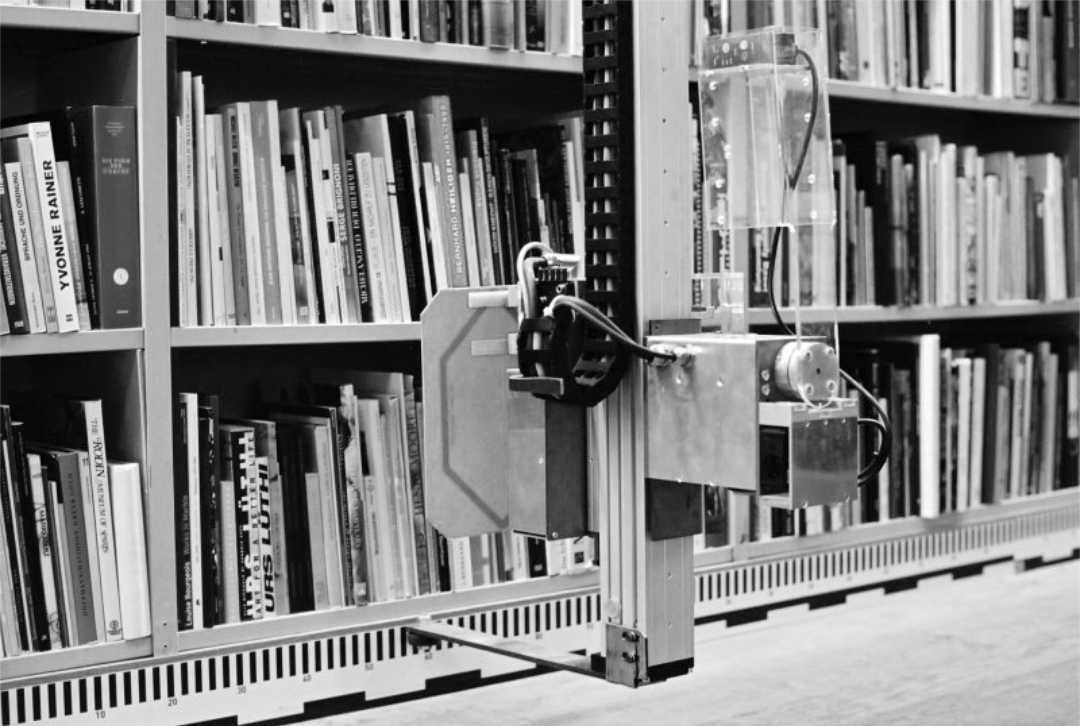
Building taxonomies and classification systems isn’t unique to machine learning systems. Commonly used library classification systems like the Library of Congress Subject Headings and the Dewey Decimal system have been extensively discussed as sites where knowledge and power intersect. There are many examples of libraries exploring alternative systems of categorization. One such example is Sitterwerk, located in Switzerland, where patrons are encouraged to reorganize books as they like, with the ever shifting, collective categorization being catalogued by little scanning robots.
Unstable Label builds from these examples of constantly changing categorization systems, applying it to a machine learning context. Every contributor in the system has to create their own categories, resulting in an ever expanding, but collectively defined model. Rather than having a categorization system created through the voting body of academics, Unstable Label envisions a participatory algorithm where contributors not only contribute data, but also towards the taxonomy that underlies that data.
The categorization systems used in COCO and ImageNet represent what Kate Crawford has described as “a silently calculated public of assumed consensus and unchallenged values.” Unstable Label creates the space to contest those values through a participatory process of category definition.
Try it Yourself:
- First the system evaluates the image from the datasource, displaying those labels as predicted by the current version of the model. You can see those labels outlined in white below.
- Next, you can click on any one of those categories or labels to re-contextualize it.
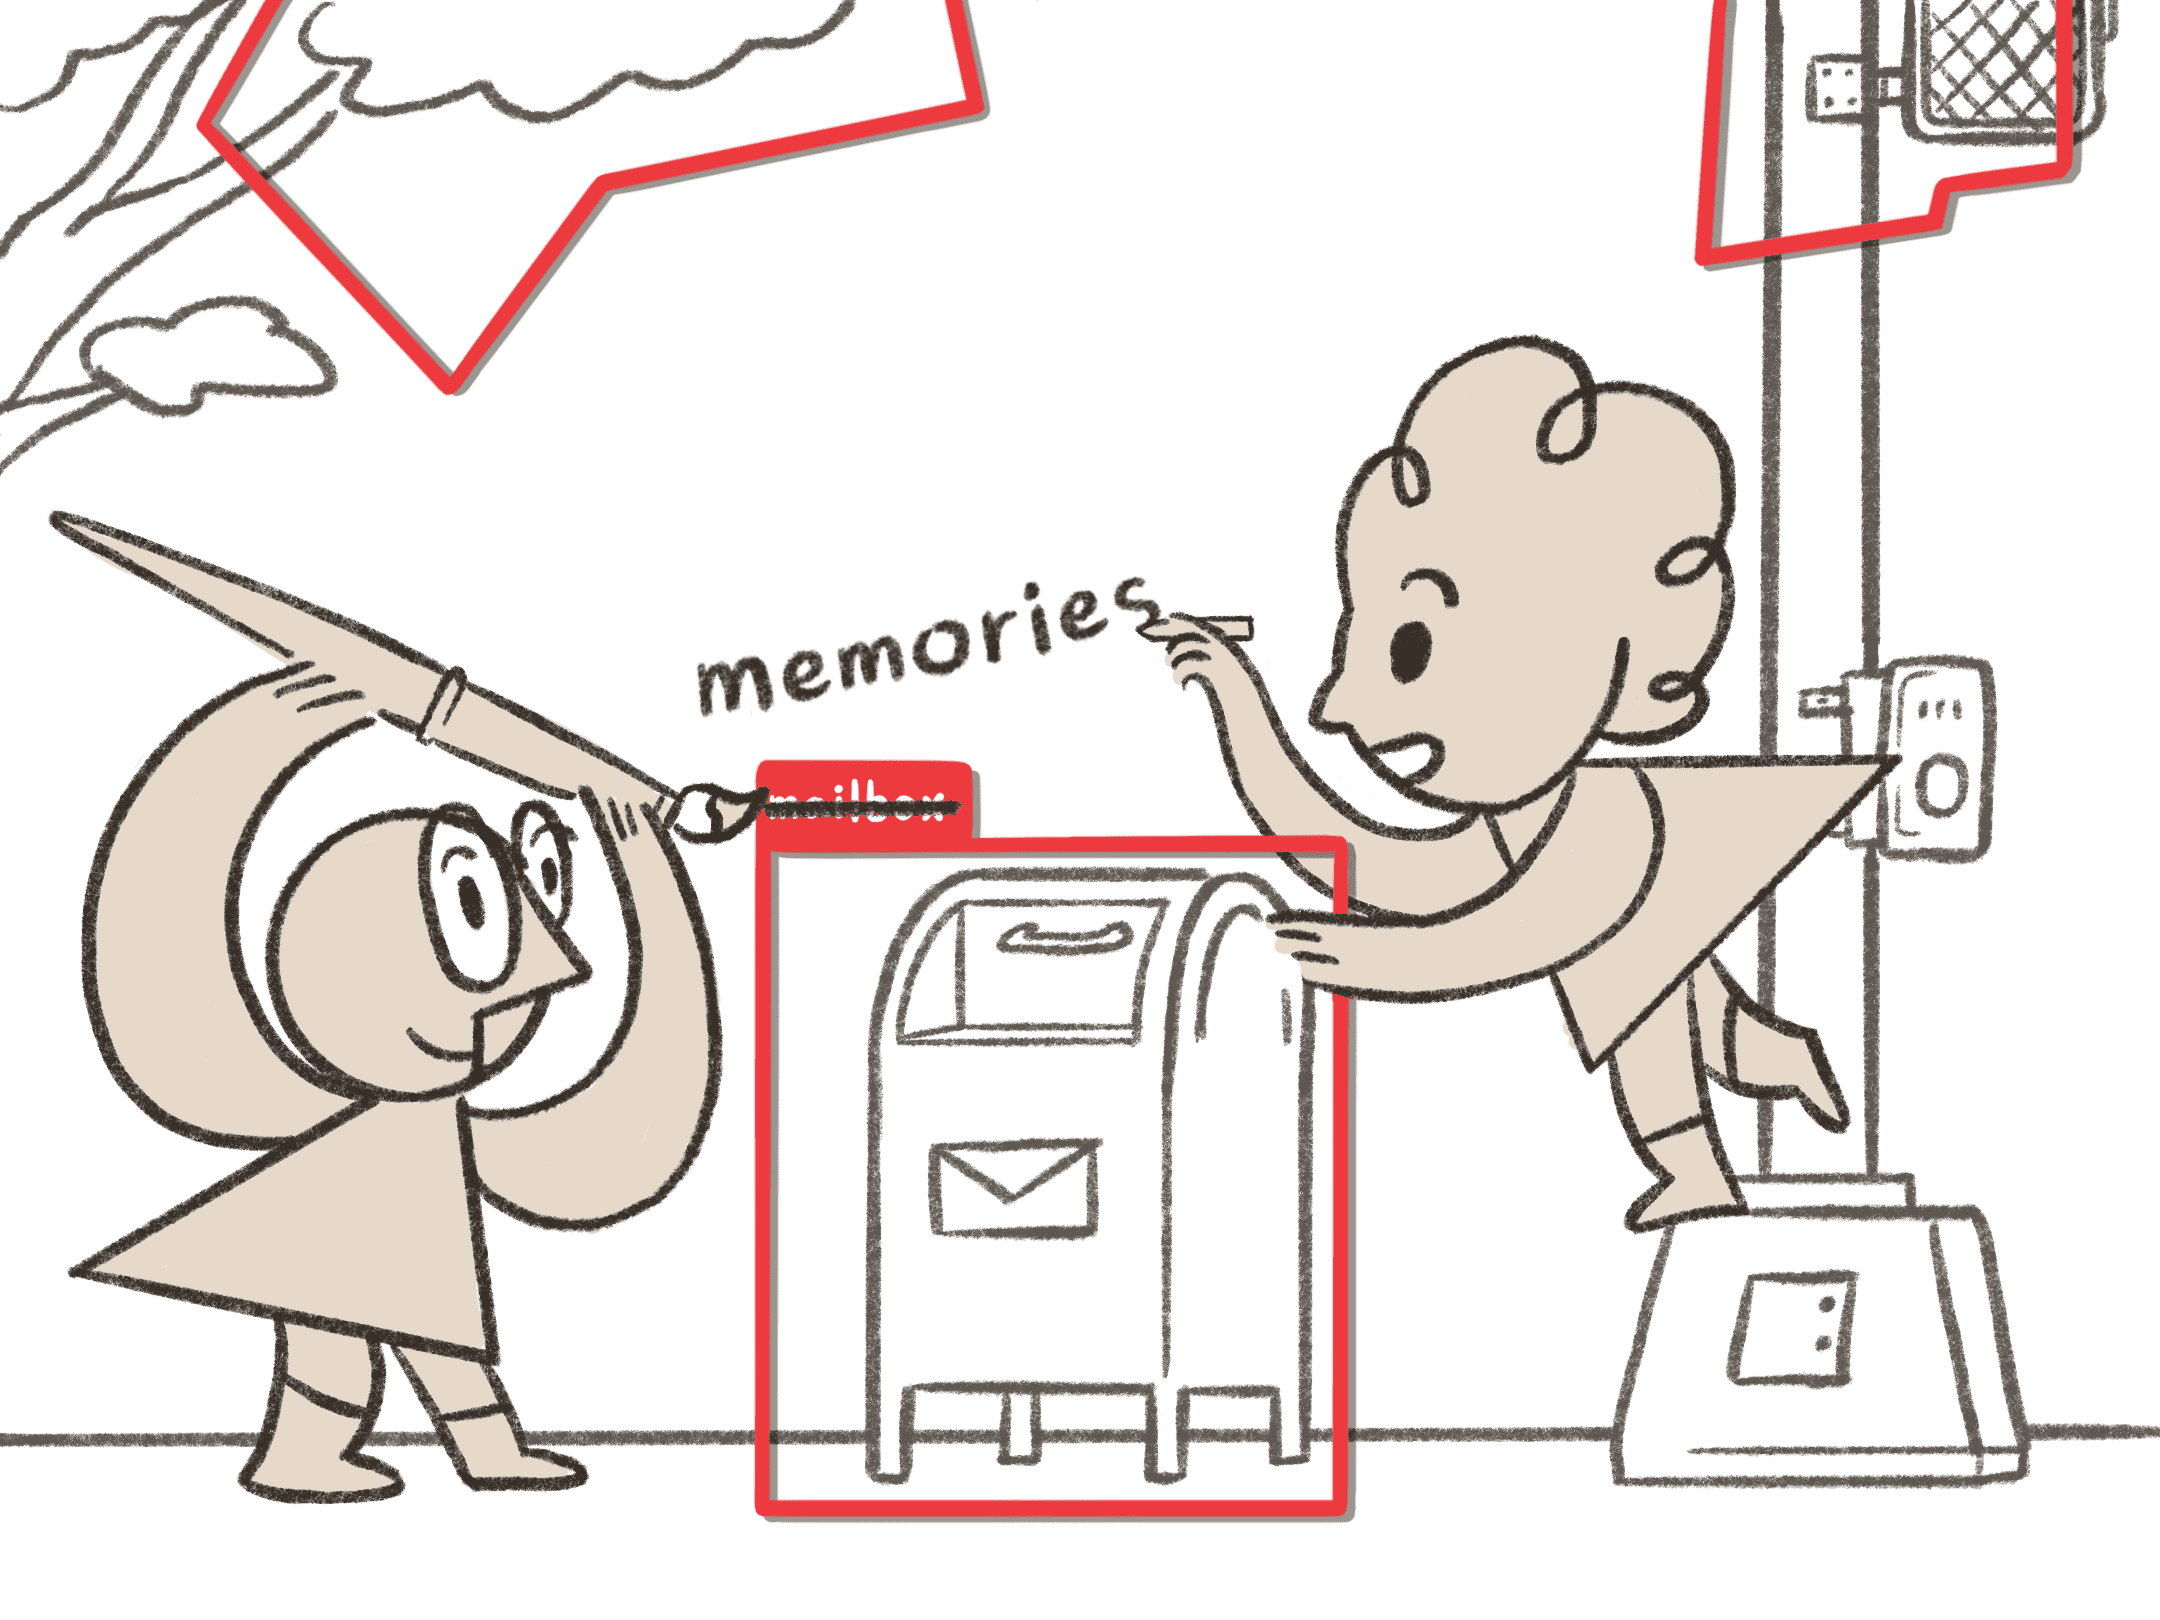
- Through conversation with the people around you, and informed by the original description of the category (written by a previous contributor), you write a new category name, and an associated description, telling your own small story to go along with that category name.
- Finally, hit the submit button, which will make your new category available to you in the next step, Drawing Data.
evaluating model at current location
The process of relabeling happens as a small group conversation discussing the existing labels within your specific context: stories that it makes you think of or experiences it reminds you of. Seemingly universal categories like “parking lot” can have very different meanings in different contexts. For example, people have had a discussion about teen hangout spots from that original label, which led to another discussion about the different definitions of rich kids in different cities. After the discussion, the contributor added those two words into the system as new categories.
This process of relabeling is less about “correcting” the algorithm than it is about incorporating your narratives and local specificity into the dataset.
The description field serves as a limited means to capture the narratives that sparked the creation of the new category. These narratives and stories are at the core of Unstable Label, allowing the “data” to speak to new contributors as they relabel and create new categories.
Data is necessarily an abstraction of the world. In the context of machine learning, data is an abstraction that also has to conform to certain rules that define its shape, size, and form. Treating this process of abstraction as a process of “grooming, of control or organization… is inseparable from dehumanization.” This is why it’s so important that data gathering systems find opportunities to incorporate stories and narratives into the data: to let it be animated with people’s lived experiences, “[disrespecting] the stories data tells about itself, [refusing] its rationalization of what looks like objectivity or progress.” Far too many data gathering projects privilege the “objectivity” of the abstracted numerical data rather than the lived realities that are flattened into those data points. Unstable Label refuses those rationalizations, foregrounding situated stories over abstractions.
Categorization systems within machine learning systems are clearly sites of power that create, normalize, and enforce hierarchies and inequalities. By refusing a fixed set of categories, and inviting participation into that design site, Unstable Label experiments with approaches to shift power and give agency back to the people who are creating the data in the first place.
Drawing Data
Drawing data in Unstable Label is the capability that may look the most familiar within standard labeling interfaces (though it will likely go by a different name). If you have already created categories, then you can start drawing data by clicking the “draw data” button at the top of the edit panel. (If you have not yet created categories, see “Creating Categories.”

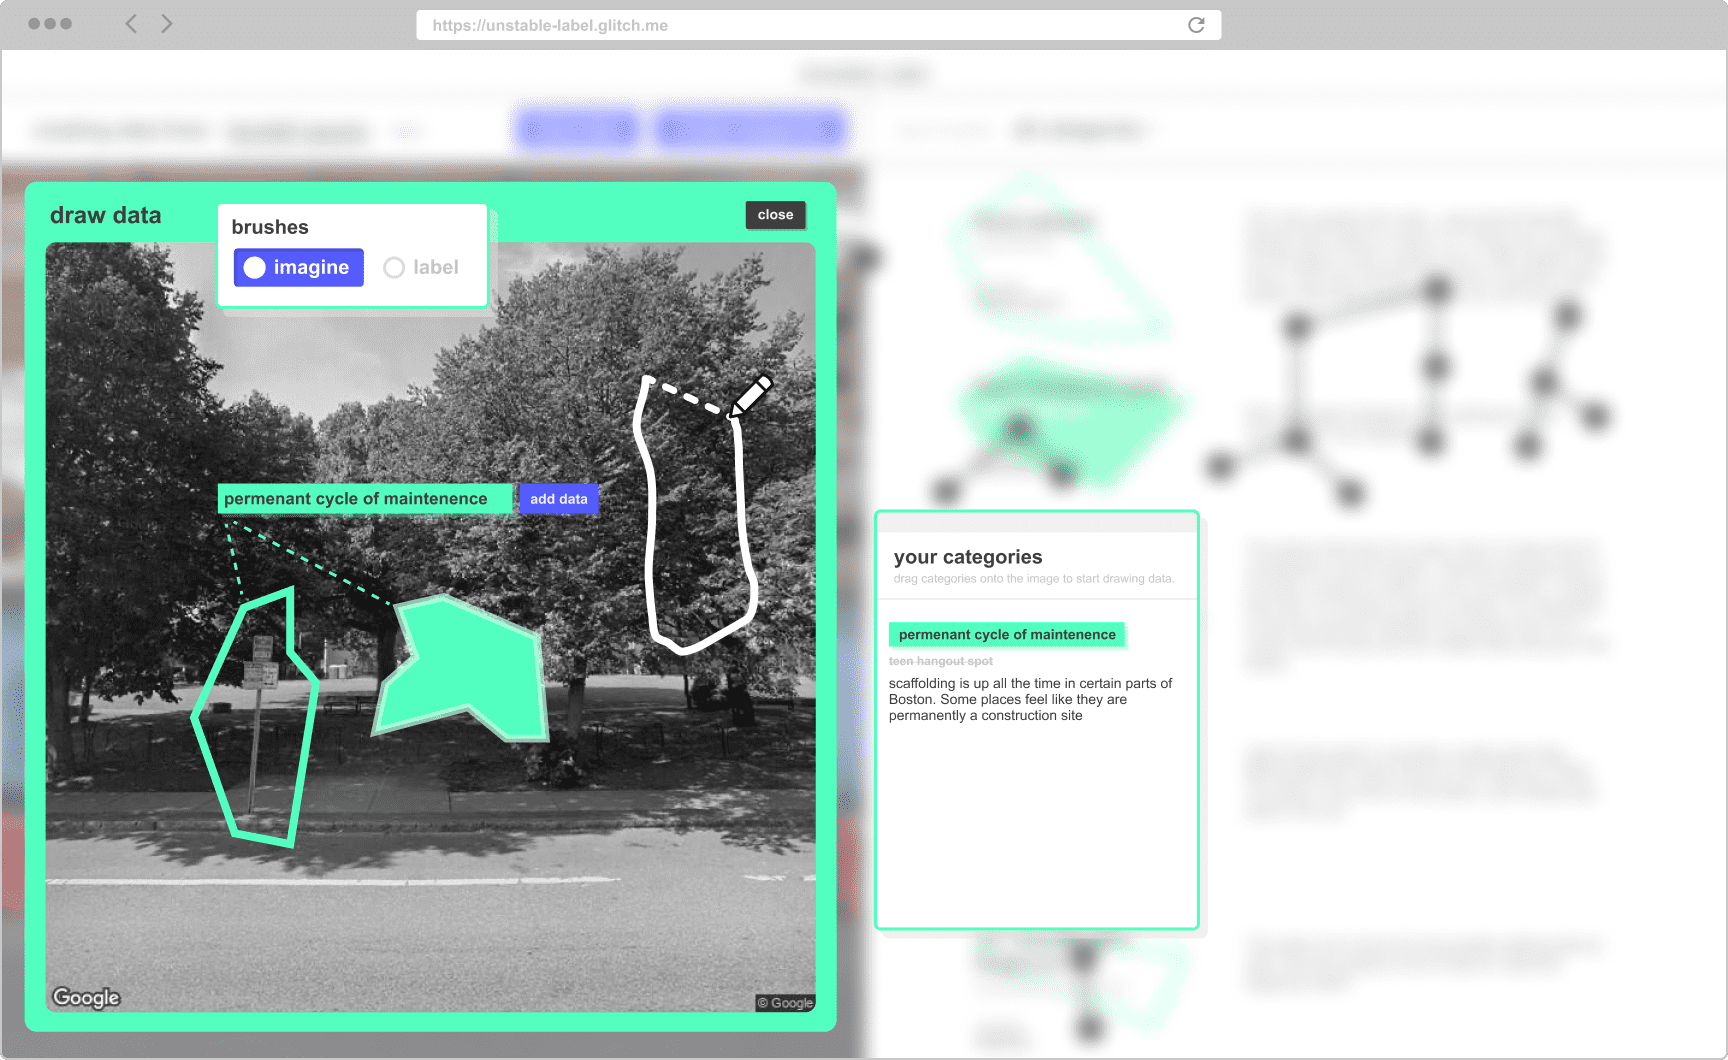
With this tool, you use the categories you’ve created earlier to annotate images which are then used to retrain the model. The process of annotating the collected information varies widely depending on the type of machine learning algorithm being used, the format of the data you are using, and what you plan to use the resulting model for.
If we were creating an image classification model, then you would need to annotate the entire image with a single category. In this case, Unstable Label is built around training an image Object Detection model. Object detection machine learning systems are variations on image classification systems, where the resulting model can identify individual entities within an image using bounding boxes. To create data to train such a model, we need to provide data that is legible to the system: a category must be associated with a bounding box, which localizes the category within the static image.
If this is a process of labeling, then why is it called “Drawing Data?”
While metaphors pose data as an objective natural resource, the production of data will always be wrapped up in subjectivity. One reason why the term “drawing” is used to describe this particular production of data is to clearly convey that by making the choice to annotate something and not something else, you are explicitly bringing your values and worldview into the dataset and the resulting model. Many of the harms of data-driven technologies are caused by the “mythologization of data as pure and purifying,” for example providing the supposedly “objective” evidence to extend police narratives of “Blackness as criminal.” Data-driven projects like predictive policing are reliant on visions of data as a purifying agent, natural force, or resource for consumption, because it obscures the human agency, ideology, and subjectivity that is actually behind the project.
It’s crucial that projects like this that rely on the objectivity of data are dismantled, replaced instead with approaches oriented towards justice and equity, that understand data as a material this is formed, shaped, and created by people, and all their values, perspectives, and worldviews.
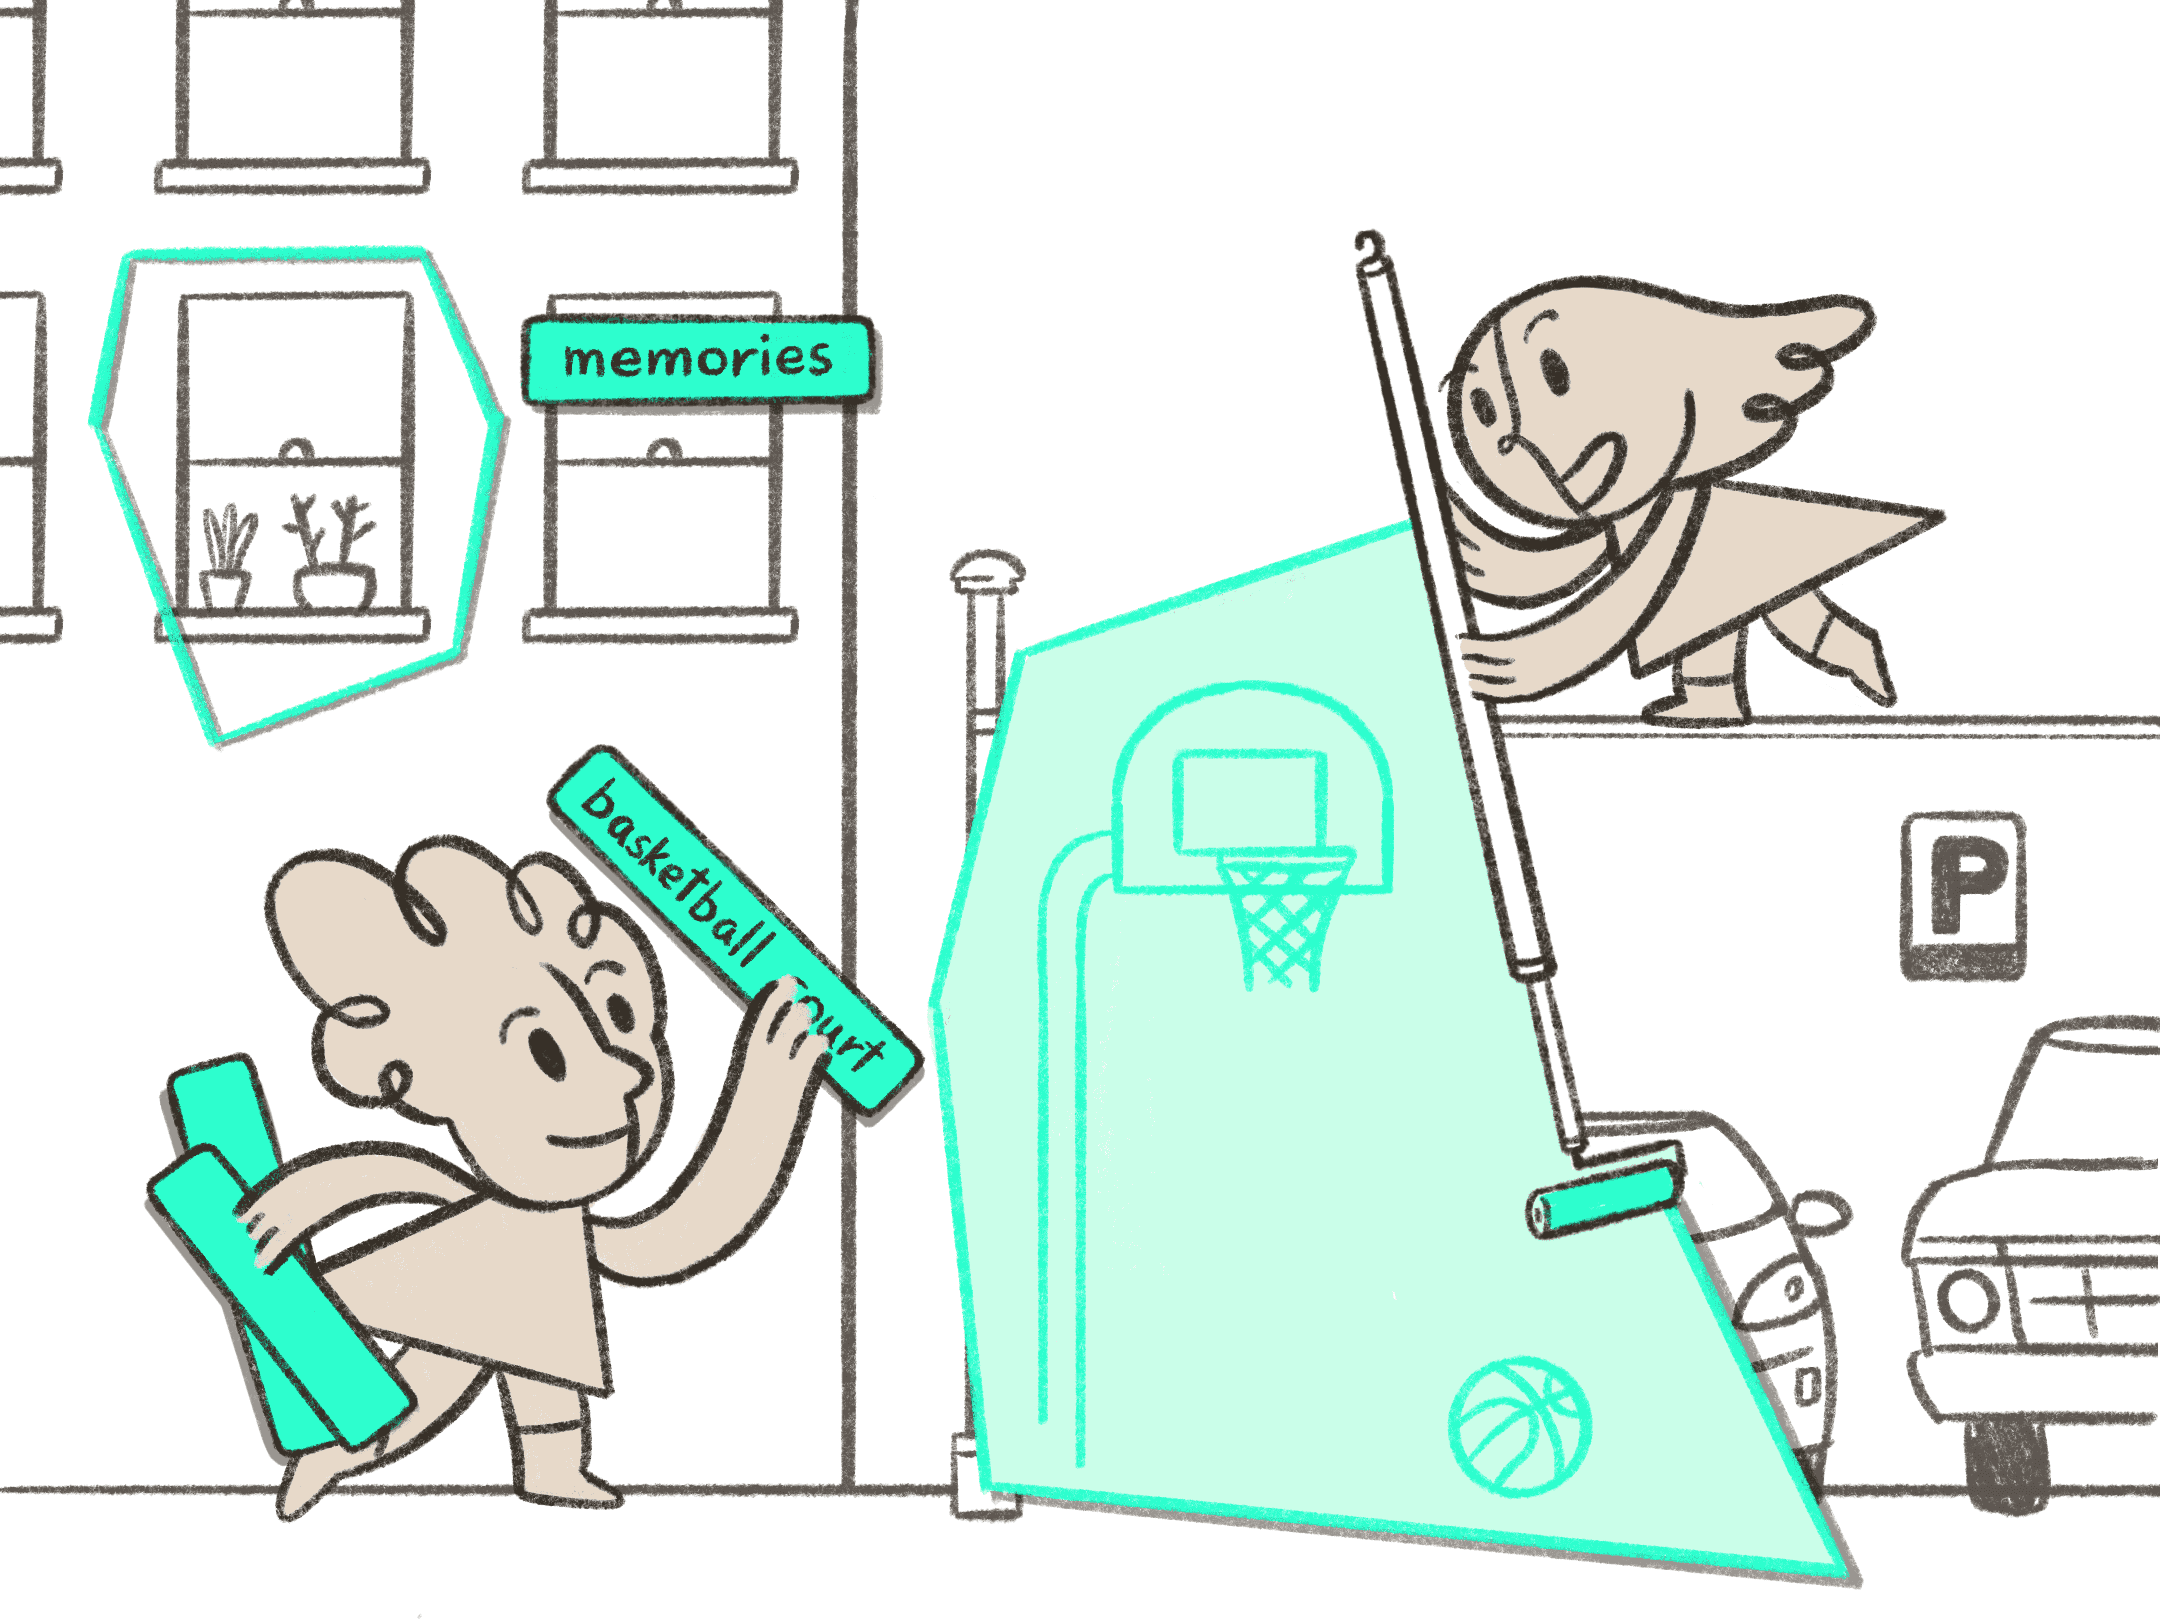
To reinforce these ideas of data, in Unstable Label, you are provided a free form drawing brush to create abstract shapes as bounding boxes. Bounding box annotations are conventionally used as a means to translate between people’s process of finding meaning within an image and a computer’s mathematical reading of that same image. The bounding box is defined by the pixel coordinates, which allows the machine learning algorithm to “learn” from the image.
Try it Yourself:
- Drag any of the categories you created earlier (or the example category already defined) onto the image.
- In the brush dialog, choose “label” or “imagine” to change the type of annotation you are going to create. “Label” is describing the world as it currently is, while “Imagine” is about labeling it as you wish it existed.
- With the text category you dragged in selected (in step 1), hold down your cursor while drawing a shape around the area of the image you want to annotate. Feel free to repeat as many times as you would like.
- Press the “add data” button when you are done to add those labels into the dataset.
your categories
example category
crazy traffic
This is an example category. Normally, you would have to create your own.
Drag a category from the dialog box to start
Using the brush interface poses creating data as a creative activity rather than an administrative one. Creating machine learning models are projects of worldbuilding: each algorithm is fed data to create a computational vision of the world, which is then deployed into the world as if it reflects reality. Machine learning systems, including the data that informs them, have taken the position as truth-maker today even though the predictions and insights that it creates are fabrications. Instead of revealing some objective truth, these predictions represent the aspirational visions of the people who created the system.
Based on this interpretation of machine learning, data creation becomes a creative medium where you can contribute both your current and future visions of the world. In Unstable Label, you have two options: label and imagine. You can annotate images as you currently see it or as you wish it to be, explicitly including your aspirational visions of the world into the resulting model.
Through Unstable Label, you can embrace the imaginative potential of data creation rather than striving for the impossibility of objective data. Instead of trying to create an “accurate” model of the world, the goal of the Unstable Label system is to build fictional worlds that embody multiple ways of seeing.
References
- N. Katherine Hayles, How We Became Posthuman (Chicago: The University of Chicago Press, 1999): 2.↵
- Hayles, How We Became Posthuman, 54.↵
- Anna Tsing, The Mushroom at the End of the World: On the Possibility of Life in Capitalist Ruins (Princeton: Princeton University Press, 2015): 5.↵
- Mimi Onuoha, "The Point of Collection," Data & Society: Points, February 10, 2016, https://points.datasociety.net/the-point-of-collection-8ee44ad7c2fa.↵
- Sasha Costanza-Chock, Design Justice: Community Led Practices To Build the Worlds We Need (Cambridge: MIT Press, 2020).↵
- Sam Lavigne, Francis Tseng, and Brian Clifton, "White Collar Crime Risk Zones," The New Inquiry, April 26, 2017, https://thenewinquiry.com/white-collar-crime-risk-zones.↵
- Kate Crawford and Trevor Paglen, "Excavating AI: The Politics of Images in Machine Learning Training Sets," accessed July 4, 2020, https://excavating.ai.↵
- Tsung-Yi Li et al., "Microsoft COCO: Common Objects in Context," In ECCV: European Conference on Computer Vision, Zurich, Switzerland, September 6-12, 2014, https://doi.org/10.1007/978-3-319-10602-1_48.↵
- Rosten Woo, "Can I help you find something?," accessed February 16, 2020, http://rostenwoo.biz/index.php/abouthaystacks.↵
- Kate Crawford, "Can an Algorithm be Agonistic? Ten scenes from Life in Calculated Publics," Science, Technology, & Human Values 41, no.1 (2015): 77-92, https://doi.org/10.1177/0162243915589635.↵
- Os Keyes, "Gardener's Vision of Data," Real Life Magazine, May 6, 2019, https://reallifemag.com/the-gardeners-vision-of-data.↵
- Sun-ha Hong, Technologies of Speculation: The Limits of Knowledge in a Data-Driven Society (New York: NYU Press, 2020): 11.↵
- Hong, Technologies of Speculation, 20.↵
- Stop LAPD Spying Coalition, "The People’s Response to OIG Audit of Data-Driven Policing," Self Published, March 11, 2019, stoplapdspying.org/wp-content/uploads/2019/03/Peoples_Response_with-hyper-links.pdf.↵
- Anna Lauren Hoffman and Luke Stark, "Data is the New What? Popular Metaphors & Professional Ethics in Emerging Data Culture," Journal of Cultural Analytics, n.p, https://doi.org/10.22148/16.036.↵
- Hong, Technologies of Speculation, 2.↵
- Hong, Technologies of Speculation, 20.↵
- Free Radicals and Stop LAPD Spying Coalition, "The Algorithmic Ecology: An Abolitionist Tool for Organizing Against Algorithms," Self Published, March 2, 2020, https://stoplapdspying.medium.com/the-algorithmic-ecology-an-abolitionist-tool-for-organizing-against-algorithms-14fcbd0e64d0.↵
- Tsing, The Mushroom at the End of the World, 29.↵

